
Las Vegas Housing Stats November 2019 –
First, please click on the link Las Vegas Housing Stats November 2019 for the full report so you have a visual to follow along with.
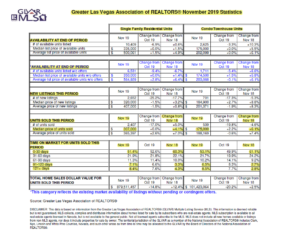
- Homes: The median price point for November 2019 was $307,000. This is the same from last month and a 4.1% increase from November 2018.
- Condo/Townhomes: The median price for November 2019 was $175,000. This is up 6.1% from last November.
- Homes: The number sold in November 2019 was 2,407, which was a decrease of 17% from October 2019, and an increase of 5.0% from November 2018.
- Condo/Townhomes: Number of units sold in November 2019 was 539, which was down by 19.8 % last month and down by 4.6% from last November.
- Homes: New listings that came on the market in November 2019 were 3,544. Basically, unchanged from last month and down 7.9% from November 2018.
- Condo/Townhomes: New listings that came on the market in November 2019 was 701, down 17.9% from last month and down 5.3% from last year at this time.
- Homes: The number of available homes listed without offers in November 2019 was 7,210. This is down 1.7% from September 2019, but an increase of 4.2% from November 2018.
- Condo/Townhomes: The number of available units without offers in November 2019 was 1,808. This is up 15.7% from November 2018.
- Time on market for Homes sold: 0-30 days was 51.4%, last year at this time it was 60.3%. 31-60 days was 21.9% which was relatively unchanged from last month and last year currently. 61-90 days was at 11.3%, unchanged from last month, but up from last November of 10%. 91-121 days was up from last month to 7.1% and up over double from 3.3% of November 2018. For 121+ days the number was up from last month to 8.4%, however, it was up close to double when compared to November of 2018 at 4.3%.
Continued signs of Stability –
A stable market is one in which the numbers stay consistent for several months in a row and when the market has about a 6-month supply of inventory. Right now, Las Vegas still has less than a 3-month supply of homes (inventory), however, our numbers have been relatively unchanged for the last several months, except in a few key areas, which, in my opinion, are important. The first is the number of homes that sold, this number was at 2,407, this number is down up 17% from November 2018.
The second area to look at is how long properties are staying on the market. The bottom 2 tiers of 91-120 days and 121+ days have basically doubled to 7.1%(91-121 days) & 8.4%(121+ days). The first tier of 0-30 days is down to 51.4% for November 2019, this has decreased by 8.9% when compared to November 2018. With the middle tiers also gaining in numbers as well. What this stat basically means is that it is taking longer for properties to sell!
The median price point for the Las Vegas Market is at $307,000 –
The median price point for the Las Vegas Market is at $307,000, which is a 4.1% increase from November 2018. Last month the median price point for the Las Vegas Market was at $310,000. This is still the smallest year-over-year increase since June 2012. The current Las Vegas Median Price point is only $8k away from when pricing peaked out at $315,000 in June of 2006. The Las Vegas Market has also seen a slowdown in 2019 with the number of homes that have been selling versus last year. The slowdown is also being felt in the number of homes listed without an offer when compared to last year at this time, which I explained previously. A quick recap of these specific numbers; October 2019 was up 4.2% September 2019 was up 19.3%, August 2019 was up 33.5%, July 2019 was up 63.1%, and June 2019 it was up by 80.3%.
In a nutshell, the Las Vegas market inventory is up from a year ago, however, this number has been consistent over the last several months. At the current sales pace, the Las Vegas Valley has less than a 3-month supply of inventory.
GLVAR reported that properties purchased in November with cash were at 23.7%, which is down from 26.1% in November 2018 and down from the peak of 59.5% in February 2013. And the number of distressed sales, short sales, and foreclosures combined are at 2% from 2.6% a year ago and just under 5% two years ago.
(Click here or on Picture for the full 8-page report.)
Hard Rock Casino is getting renamed!