Las Vegas Housing Stats Aug 2019 –
First, please click on the link Las Vegas Housing Stats Aug 2019 for the full report so you have a visual to follow along with.
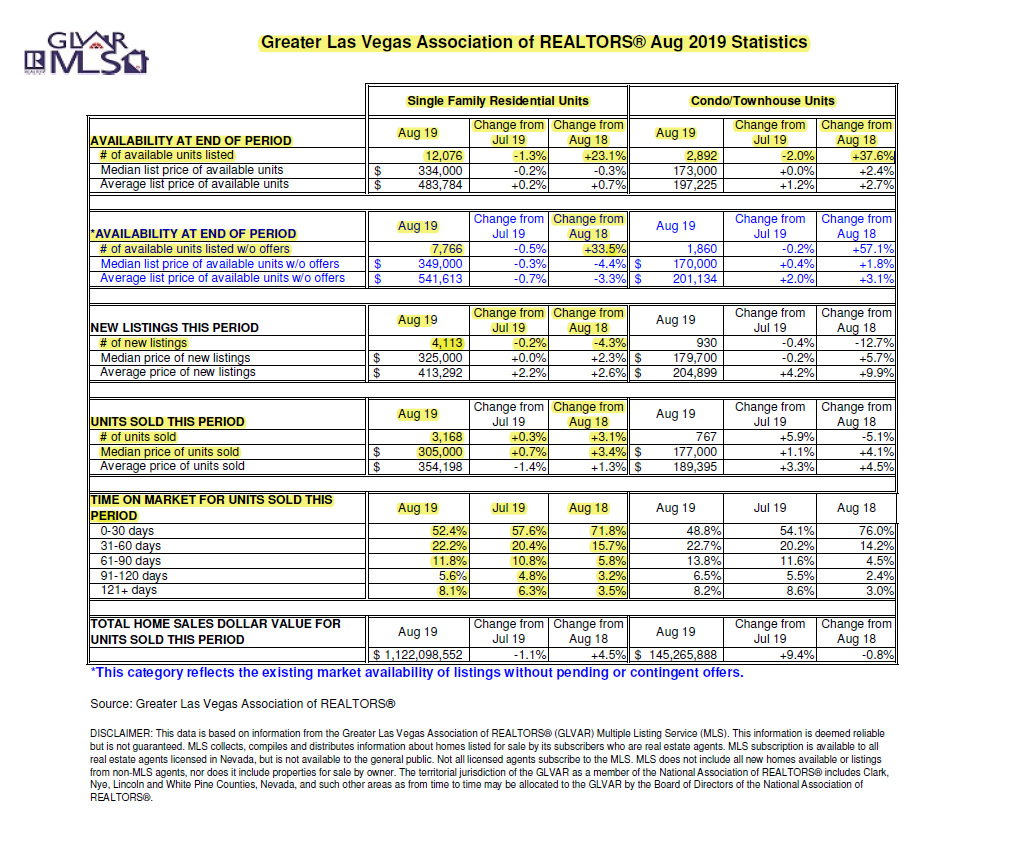
- The median price point for sold homes in August 2019 was $305,000. This is up a slightly from last month and a 3.4% increase from August 2018.
- The number of homes sold in August 2019 was 3,168, which was an increase of 0.3% from July 2019, and an increase of 3.1% from August 2018.
- The number of new listings that came on the market in August 2019 was 4,113. This is down by 0.2% from the previous month and down 4.3% from August 2018.
- The number of available homes listed without offers in August 2019 was 7,766. This is a slight decrease of 0.5% from July 2019, but a giant increase of 33.5% from August 2018.
- Time on market for homes sold: 0-30 days was 52.4%, last year at this time it was 71.8%. 31-60 days was 22.2% which was relatively unchanged from last month, but up from 15.7% in August 2018. 61-90 days was at 11.8%, slightly up from the previous month, but up double from last August of 5.8%. 91-121 days it was up slightly from last month to 5.6% and up from 3.2% of August 2018. For 121+ days was about the same for last month, however, it was over double at 8.1% compared to August of 2018 at 3.5%.
Continued signs of Stability –
The reporting real estate guru’s say that a stable market is one in which the numbers stay consistent for several months in a row and when you have around a 6-month supply of inventory. Right now, Las Vegas still has less than a 3-month supply of homes (inventory). The Las Vegas numbers have been relatively unchanged for the last several months, expect in a few key areas, which, in my opinion are important. The first is the number of homes that are available without offers, this number is at 7,766, up 33.5% from last year at this time. This number has been consistently going up over the last several months when compared to last year at this time. The second area to look at is how long properties are staying on the market. The bottom tiers of 61-90 days, 91-120 days, and 121+ days have basically doubled, and the first tier of 0-30 days is down over 19% from 71.8% in August 2018 to 52.4% in August 2019.
What the above stat means is that it is taking longer for properties to sell!
The median price point for the Las Vegas Market is at $305,000, which is a 3.4% increase from August 2018. Last month the median price point for the Las Vegas Market was at $303,000. This is still the smallest year-over-year increase since June 2012. The current Las Vegas Median Price point is only $10k away from when pricing peaked out at $315,000 in June of 2008. The Las Vegas Market has also seen a slowdown in 2019 with the number homes that have been selling versus last year. The slowdown in the Las Vegas Market has really been felt in the number of homes listed without an offer, which I explained above. July 2019 this number was up 63.1% and June 2019 it was up by 80.3%.
Las Vegas currently has less than a 3-month supply of homes on the market, but this number has continued to grow over the last several months which continues to point towards a balanced housing supply. This does not mean we have to hit the panic button as the Las Vegas area has had tremendous growth over the last several years. GLVAR reported that properties purchased in August with cash were at 22.7%, which is down from 24.6% in August 2018 and down from the peak of 59.5% in February 2013. And the number of distressed sales, short sales, and foreclosures combined is at 2.1% from 2.5% a year ago and 6.1% two years ago.
For the complete 8-page report please call/text me at 702-427-9444.
(Click here or on Picture for full 8 page report.)