May 2020 Las Vegas Housing Market Stats –
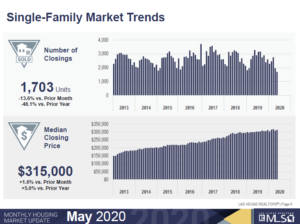

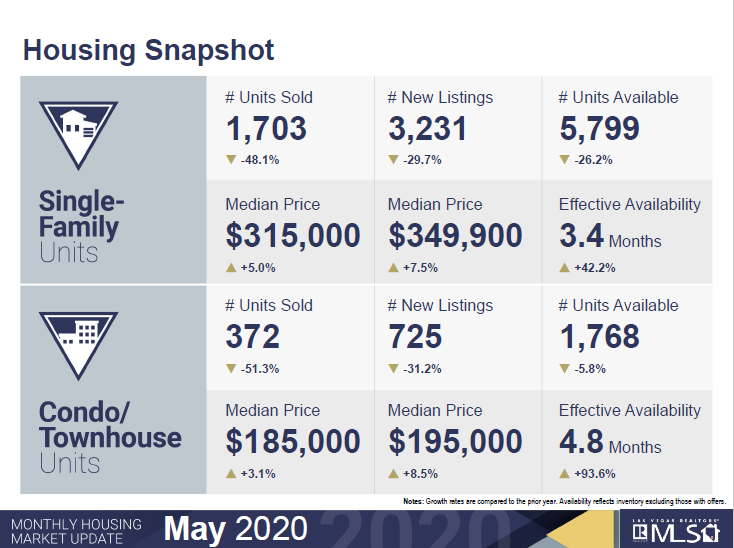
Homes: The median price point for May 2020 was $315,000. This is up from last month by 1.6% and a 5% increase from May 2019.
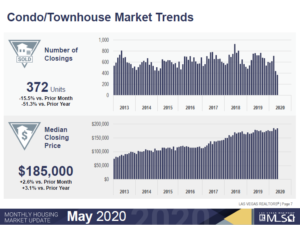
Condo/Townhome’s: The median price for May 2020 was $185,000. This is increase of 2.6% from last month and up 3.1% from last May.
Homes: The number of units sold in May 2020 was 1,703, which was a decrease of 13.6% from last month and a 48.1% decrease from May 2019.
Condo/Townhome’s: The number of units sold in May 2020 was 372, which was down by 15.5% last month and down by 51.3% from last May.
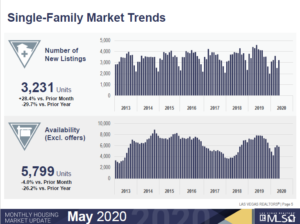
Homes: New listings that came on the market in May 2020 were 3,231. This is up 28.4% from last month and down 29.7% from last May.
Condo/Townhome’s: New listings that came on the market in May 2020 were 725, up 13.6% from last month and down 31.2% from last year at this time.
Homes: The number of available homes listed without offers in May 2020 was 5,799. This is down 4% from last month, and a decrease of 26.2% from May 2019.
Condo/Townhome’s: The number of available units without offers in May 2020 was 1,768. This is down 0.2% from last month and a decrease of 5.8% from May 2019.
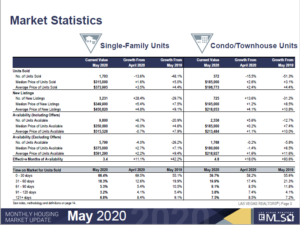
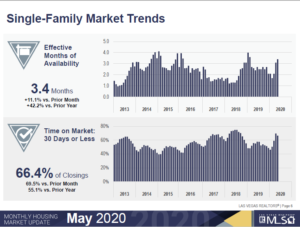
Time on market for Homes sold: 0-30 days was 66.4%, last year at this time it was 55.1%. 31-60 days was 18.3%, last May this was at 19.9%. 61-90 days was at 5.3%, last May was 10.5%. 91-121 days was at 3.2%, last year was at 5.4%. For 121+ days the number was 6.8%, last year it was at 9.1%.
Covid-19 Impact –
The Las Vegas market is continuing to feel the impact of Covid-19. Beginning with the number of Homes sold for May 2020, this number is down 13.6% from April 2020 and down 48.1% from last year at this time. Condo/Townhome’s followed the same pattern as they were down 15.5% from April 2020 and down 51.3% from last May. The number of new homes listed was up compared to last month by 28.4%, however, it was down from last year at this time by 29.7%. Condo/Townhome’s followed the same pattern, up 13.6 from last month and down 31.2% from last year at this time.
A bright spot is the home median price point for the Las Vegas Market is at $315,000, which was an increase of 1.6% from last month and a 5.0% increase from May 2019. Condo/Townhome’s mirrored homes as the median price were at $185,000 with a 2.6% increase from last month and a 3.1% increase from May 2019.
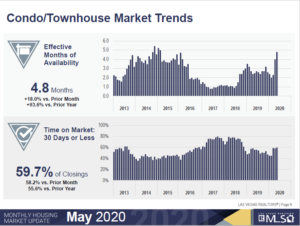
The housing inventory is starting to slowly rise. And I say slowly because the number of homes that are being listed is down when compared to last year at this time. Usually, in the spring we see a flurry of activity in these areas. At the current sales pace, the Las Vegas Valley Housing Market has about a 3.4 month’s supply of inventory. This is up 11.1% from last month and up 42.2% from last year in May. The Condo/Townhome’s supply is at 4.8 months. This is up 18% from last month and up 93.6% when compared to last year at this time.
GLVAR reported that properties purchased in May 2020 with cash were at 14.5%, which is down from 20.4% in May 2019 and down from the peak of 59.5% in February 2013. And the number of distressed sales, short sales, and foreclosures combined are at 1.5% compared to 2% a year ago and 2.6% two years ago, and 6.8% three years ago.
For the complete 15 pg report:
Showing Time Numbers for Las Vegas
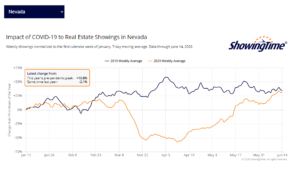
The chart above shows the number of showing via “Showingtime”, a technology platform in which agents can set up showings for available listings. You will notice that the numbers have steadily increased from mid-April, 2020. This graph above was pulled on June 15th, 2020. The general public has access to these number at https://www.showingtime.com/impact-of-coronavirus/

