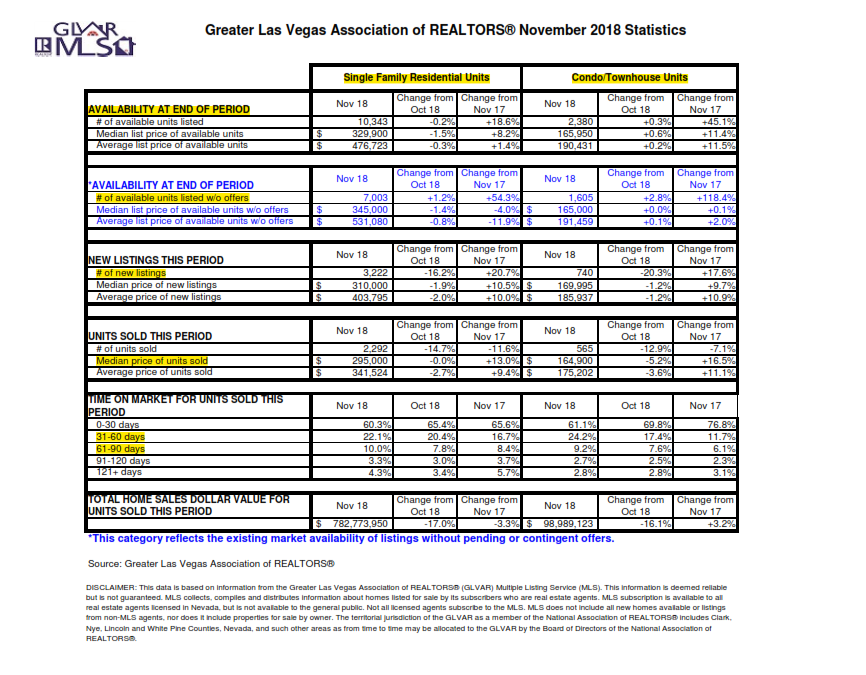
Snapshot of the Las Vegas November 2018 Housing Stats.
-The median price point for sold homes in November 2018 was $295,000. This is unchanged from the previous month, however, a 13% increase from Nov 2017.
-The number of homes sold in November 2018 was 2,292, which was a decrease of 14.7% from October 2018 and a decrease of 11.6% from November 2017.
-The number of new listings that came on the market in November 2018 was 3,222. This is down 16.2% from the previous month, however, up 20.7% from November 2017.
-The number of available homes listed without offers in November 2018 was 7,003. This is an increase of 1.2% from October 2018 and increase of 54.3% from November 2017.
-Time on market for homes sold: 0-30 days was 60.3%, last month this number as at 65.4%. We saw an increase from 31-60 days to 22.1% and 61-90 days to 10%. From 91-121+ was relatively unchanged.
The numbers are indicating that the Las Vegas Housing Market is continuing to show signs of a slowdown. This is evident by the decrease of homes sold in November by 14.7% from October while at the same time the number of homes listed without offers was at 7,003. This is 54.3% increase from November 2017. The median price point for the Las Vegas Market is still hovering at $295,000, which is still a 13% increase from November 2017. This does not mean we have to hit the panic button. We have had tremendous growth over the last several years and to continue on that type of trajectory was almost impossible.

