April 2020 Las Vegas Housing Market Stats –

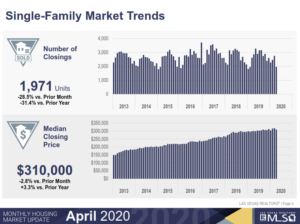

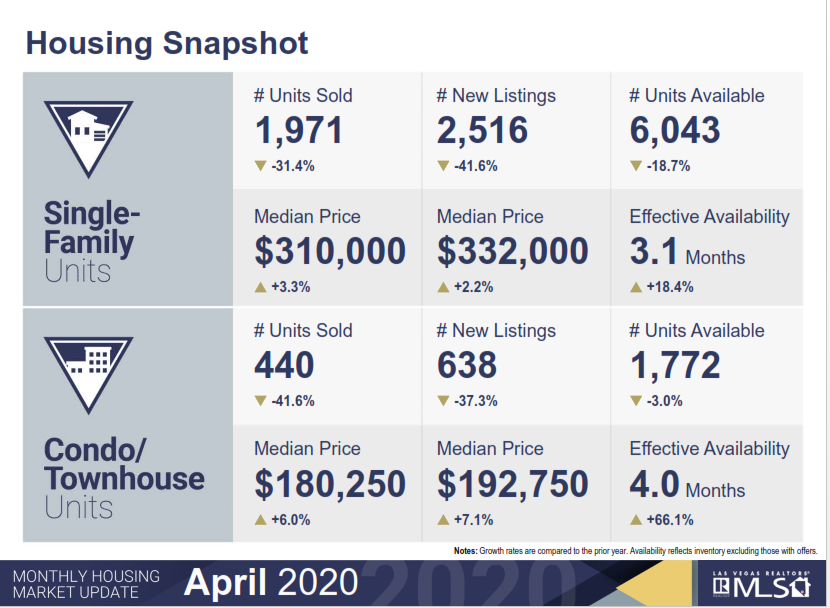
Homes: The median price point for April 2020 was $310,000. This is down from last month by 2.8% and a 3.3% increase from April 2019.
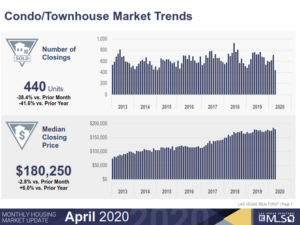
Condo/Townhome’s: The median price for April 2020 was $180,250. This is down 2.8% from last month and up 6% from last April.
Homes: The number of units sold in April 2020 was 1,971, which was a decrease of 28.5% from last month and a 31.4% decrease from April 2019.
Condo/Townhome’s: The number of units sold in April 2020 was 440, which was down by 38.4% last month and down by 41.6% from last April.
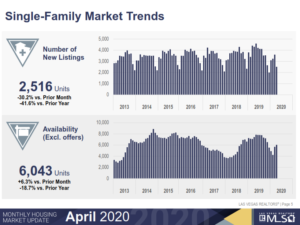
Homes: New listings that came on the market in April 2020 were 2,516. This is down 30.2% from last month and down 41.6% from last April.
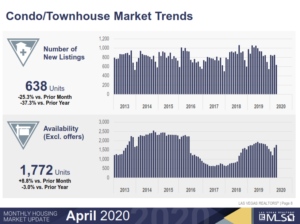
Condo/Townhome’s: New listings that came on the market in April 2020 were 638, down 25.3% from last month and down 37.3% from last year at this time.
Homes: The number of available homes listed without offers in April 2020 was 6,043. This is up 6.3% from last month, and a decrease of 18.7% from April 2019.
Condo/Townhome’s: The number of available units without offers in April 2020 was 1,772. This is up 8.8% from last month and a decrease of 3% from April 2019.
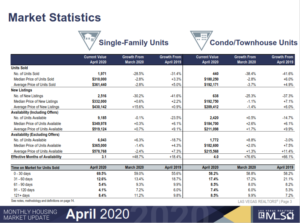
Time on market for Homes sold: 0-30 days was 69.5%, last year at this time it was 59%. 31-60 days was 12.6%, last April this was at 18.7%. 61-90 days was at 5.4%, last month this was at 9.3% and 9.9% last year. 91-121 days was at 4.1%, last month was 7.2% and 6% last year. For 121+ days the number was 8.4%, which was at 11.2% last month and 9.8% last year at this time.
Covid-19 Impact –
The Las Vegas market is now starting to feel the impact of Covid-19. Starting April 2020 Las Vegas Housing Market Stats with the number of Homes Sold, this number is down 28.5% from March 2020 and down 31.4% from last year at this time. Condo/Townhomes followed the same pattern as they were down 38.4% from March 2020 and down 41.6% from last year. The number of new homes listed was down for April as well to 2,516, this is a 30.2% drop from last month and a 41.6% drop from last year at this time. Condo/Townhome’s followed the same pattern but down to 638, which is a 25.3% decrease from last month and a 37.3% decrease from last year at this time.
The home median price point for the Las Vegas Market is at $310,000, which was a 2.8% decrease from last month and a 3.3% increase from April 2019. Condo/Townhome’s mirrored homes as the median price were at $180,250 with a 2.8% decrease from last month and a 6% increase from April 2019. The current Las Vegas Median Price point is only $5k away from when pricing peaked out at $315,000 in June of 2006.
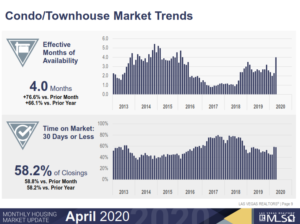
The housing inventory is starting to slowly rise. And I say slowly because the number of homes that are being listed is down when compared to last year at this time. While at the same time homes that are going under contract are dramatically down from last year at this time. Usually, in the spring we see a flurry of activity in these areas. At the current sales pace, the Las Vegas Valley Housing Market has about a 3.1 month supply of inventory. This is up 18.4% from last year at this time. The Condo/Townhome’s supply is about 4 months. This is up 66.1% when compared to last year at this time.
GLVAR reported that properties purchased in April 2020 with cash were at 13%, which is down from 21.8% in April 2019 and down from the peak of 59.5% in February 2013. And the number of distressed sales, short sales, and foreclosures combined are at 1.5% compared to 3% a year ago and 2.5% two years ago, and 8.4% three years ago.
For the complete 15 pg report:

Showing Time Numbers for Las Vegas
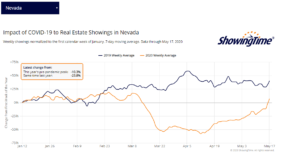
The chart above shows the number of showing via “Showingtime”, a technology platform in which agents can set up showings for available listings. You will notice that the numbers have steadily increased from mid-April, 2020. This graph was pulled on May 18th, 2020. The general public has access to these number at https://www.showingtime.com/impact-of-coronavirus/